Abstract
This chapter provides information on how to configure JCH Optimize for best performance using PageSpeed Insights to measure performance.
Table of Contents
- Using PageSpeed To Measure Performance
- Minify CSS and JavaScript
- Eliminate Render Blocking
- Reduce Unused CSS
- Reduce Server Response
- Optimize Fonts
- Add Image Attributes
- Defer Offscreen Images
- Optimize .htaccess
- Preload Critical Resources
- Efficiently Encode Images
- Reduce Unused JavaScript
- Use a Content Domain Network (CDN)/Cookie free Domain
PageSpeed Insights is a free online tool developed by Google to measure the performance of websites. It reports on the performance of a page on both mobile and desktop devices, and provides suggestions on how that page may be improved.
Google has put out a lot of guidance around performance data and performance tooling and has developed several performance tools for website administrators to assist in assessing and improving performance, of which PageSpeed Insights is only one. We'll only cover the PageSpeed Insights in this documentation as it also provides information on field data, which is where our primary aim is in improving.
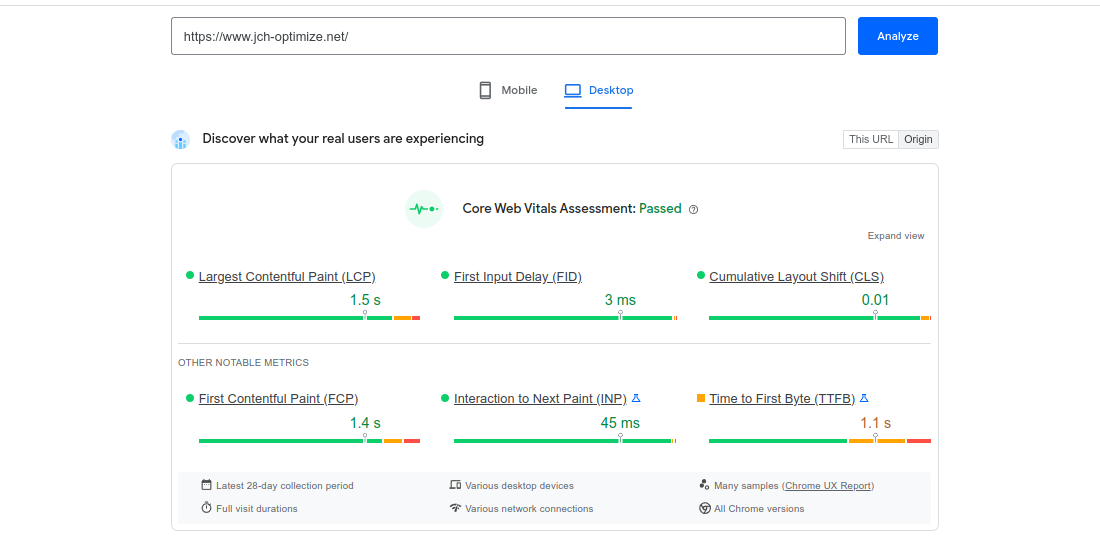
Field data is performance data collected from real page loads your users are experiencing in the wild. Though it uses a restricted set of metrics and may be difficult to debug, it captures true real-world user experience over the last 28 days and enables correlation to business key performance indicators.
When you use PageSpeed Insights to measure the performance of your website, the field data is shown on top, so you can compare it with the generated lab data.
If you're interested in page performance and SEO then this is what you want to improve.
Lab data is performance data collected within a controlled environment with predefined device and network settings. This offers reproducible results and debugging capabilities to help identify, isolate and fix performance issues. This however, cannot correlate against real-world page Key Performance Indicator .
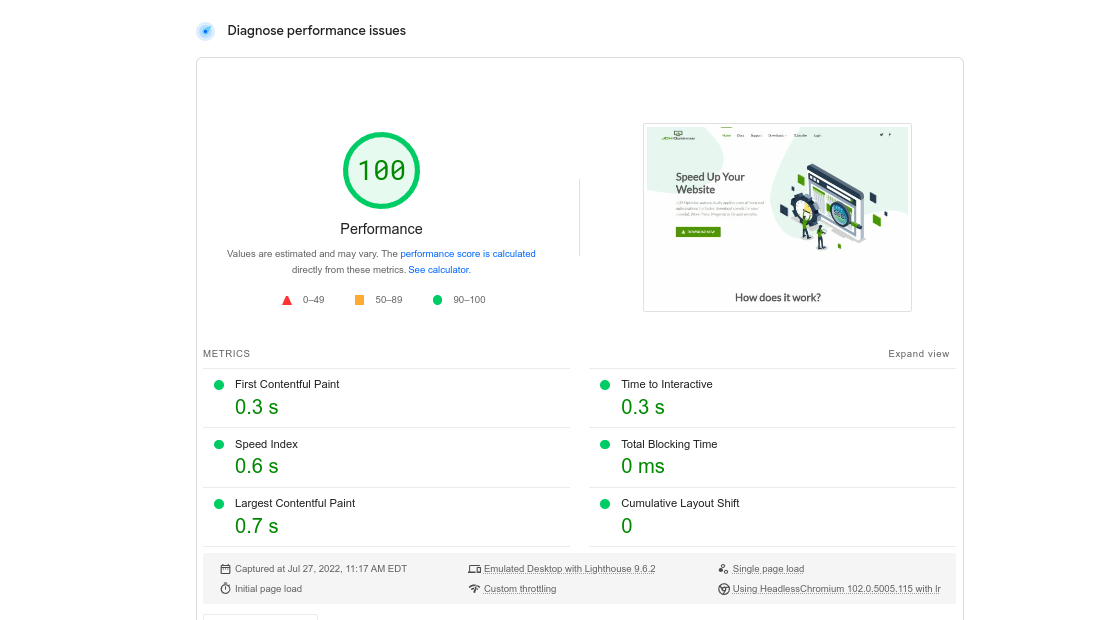
PageSpeed Insights uses Lighthouse to analyze the given URL, generating a performance score that estimates the page's performance on different metrics, including: First Contentful Paint , Largest Contentful Paint , Speed Index , Cumulative Layout Shift , Time to Interactive , and Total Blocking Time .
At the top of the section, PageSpeed Insights provides a score which summarizes the page's simulated performance. This score is determined by running Lighthouse to collect and analyze diagnostic information about the page. A score of 90 or above is considered good, 50 to 90 is a score that needs improvement, and below 50 is considered poor.
![[Note]](/media/com_docimport/admonition/note.png) | Note |
|---|---|
|
The performance score is calculated directly from the metrics detailed above. |
Lighthouse separates its audits into three sections:
-
Opportunities. Provide suggestions how to improve the page's performance metrics. Each suggestion in this section estimates how much faster the page will load if the improvement is implemented.
-
Diagnostics. Provide additional information about how a page adheres to best practices for web development.
-
Passed Audits. Indicates the audits that have been passed by the page.
| Note |
|---|---|
|
These suggestions can help your page load faster, but they don't directly affect the Performance score. Nonetheless, improving the opportunities and diagnostics likely improve the metric values, so there is an indirect relationship. |
To optimize your site, first use PageSpeed Insights to measure your page and see which metrics need improving. The following sections will provide information on how to use JCH Optimize to address some suggestions raised in the Opportunities sections based on the metrics you want to improve and how to implement some performance best practices as raised in the Diagnostics section.
First Contentful Paint marks the time at which the first text or image is painted. The following optimizations contribute towards improving this metric:
Time to Interactive is the amount of time it takes for the page to become fully interactive. The following optimizations contribute towards improving this metric.
Speed Index shows how quickly the contents of a page are visible populated. The following optimizations contribute towards improving this metric.
Sum of all time periods between FCP and Time to Interactive, when task length exceeds 50ms, expressed in milliseconds. The following optimizations contribute towards improving this metric.
Largest Contentful Paint marks the time at which the largest text or image is painted. The following optimizations contribute towards improving this metric.
Cumulative Layout Shift measures the movement of visible elements within the viewport. The following optimizations contribute to improving this metric.